
Patrik
Wise words of the week
Your most unhappy customers are your greatest source of learning. — Bill Gates
Make it work, make it right, make it fast. — Kent Beck
Journal
We currently have roughly 120 issues in our tracker. I obviously have opinions on which ones to tackle first. But prioritization is hard and can lead to analysis paralysis quickly where I spend more time deciding what to do rather than doing it.
On my side, I have two parameters to decide what to tackle. First, is it a small or a big issue. Some issues are really just a quick fix done in a couple of minutes. Typos, fields in the wrong place, wrong colors. Big issues usually require more thinking as they significantly change something deep in the system and software is often a Jenga tower where changing something in one place can cause unexpected issues in a different part of the software. It’s intellectually exciting but also risky and hard. Second, whether the new feature requires storing data in the database in a different way. This requires a migration of the database to the new format and requires some overhead and very careful rollout. So I usually group changes that touch the database together. One in four releases requires a migration.
There is also user feedback and it is really useful. Sadly, the IT business has trained users that bugs in software are a normal thing and many accept terrible situations. So, when someone raises an issue, it must be really serious and bothering them. It’s a strong signal. And we take this very seriously. The last two issues raised by our users were missing cantons (in this case GL and JU) and a problem on the results page where results didn’t add up.
The results not adding up has been bothering me for a long time. But I didn’t have a proper answer on how to solve it. After using the software myself for a long time, I eventually came to the conclusion to group assets in a more consistent way as liquidity, real estate, retirement, and grouping changes into income (money flows in from outside), expenses (money flows out), change in value (your stocks are suddenly worth more), and internal transfers (moving between assets like paying into pillar 3a or buying a house). This is now out in release 1.0.1 and I think it adds a lot of clarity.
The missing cantons are a recurring theme as people join the waitlist. So I’m going to make the next release 1.0.2 about adding GL, JU, BS, BL, and GR. This will raise our coverage from 88% to 97%.
You are awesome users, we learn a lot from you. Keep your amazing feedback coming, it’s very valuable for us, and in return you get your requests in the software within a couple of releases. Thank you!
How did I use AI this week?
In the past months, Cursor seems to have gotten really good at understanding my code base. So I can lean in much further and ask Cursor to do the changes for me. Ideally I would just point at the issue in Linear and wait, but in the past we were not disciplined and our issues are more like encrypted internal messages. This will have to change but is a different story.
Cursor did a great job in restructuring the results page. Most of the changes were simply grouping and organizing the values. But some information like the increase in value for assets was not in the results and had to be added to the report. It worked just fine. Until I ran my integration tests and realized that they were 3 times slower than before.
Behind the scenes, Cursor added a map for each group of information needed, in total three. Maps are great for their fast lookups of information. But they come with a large instantiation and iteration overhead. They are good for storing long-lived large amounts of datapoints. But in our case, they were just used to build a short-lived report (accumulating the results) and often had fewer than a dozen entries.
I was already aware of the Go maps performance, so it was easy to spot the problem. I asked Cursor to build a data structure that would behave like a map but implemented as a slice. I knew the upper bound in advance, and that the entries would be unique. It allowed me to greatly optimize the generic solution that the AI had created. In the end, it’s my fault anyway for not providing that context information.
And as a bonus, I could ask Cursor to scan my code for other maps that were under the same constraints. It found a few more instances that it could replace.
This was a great reminder that the AI is a great tool, but it also requires someone supervising and understanding the system to avoid degrading it when building a solution that is too generic and costly.
Marc
The build
I’ve continued to make tiny improvements to our UX and UI.
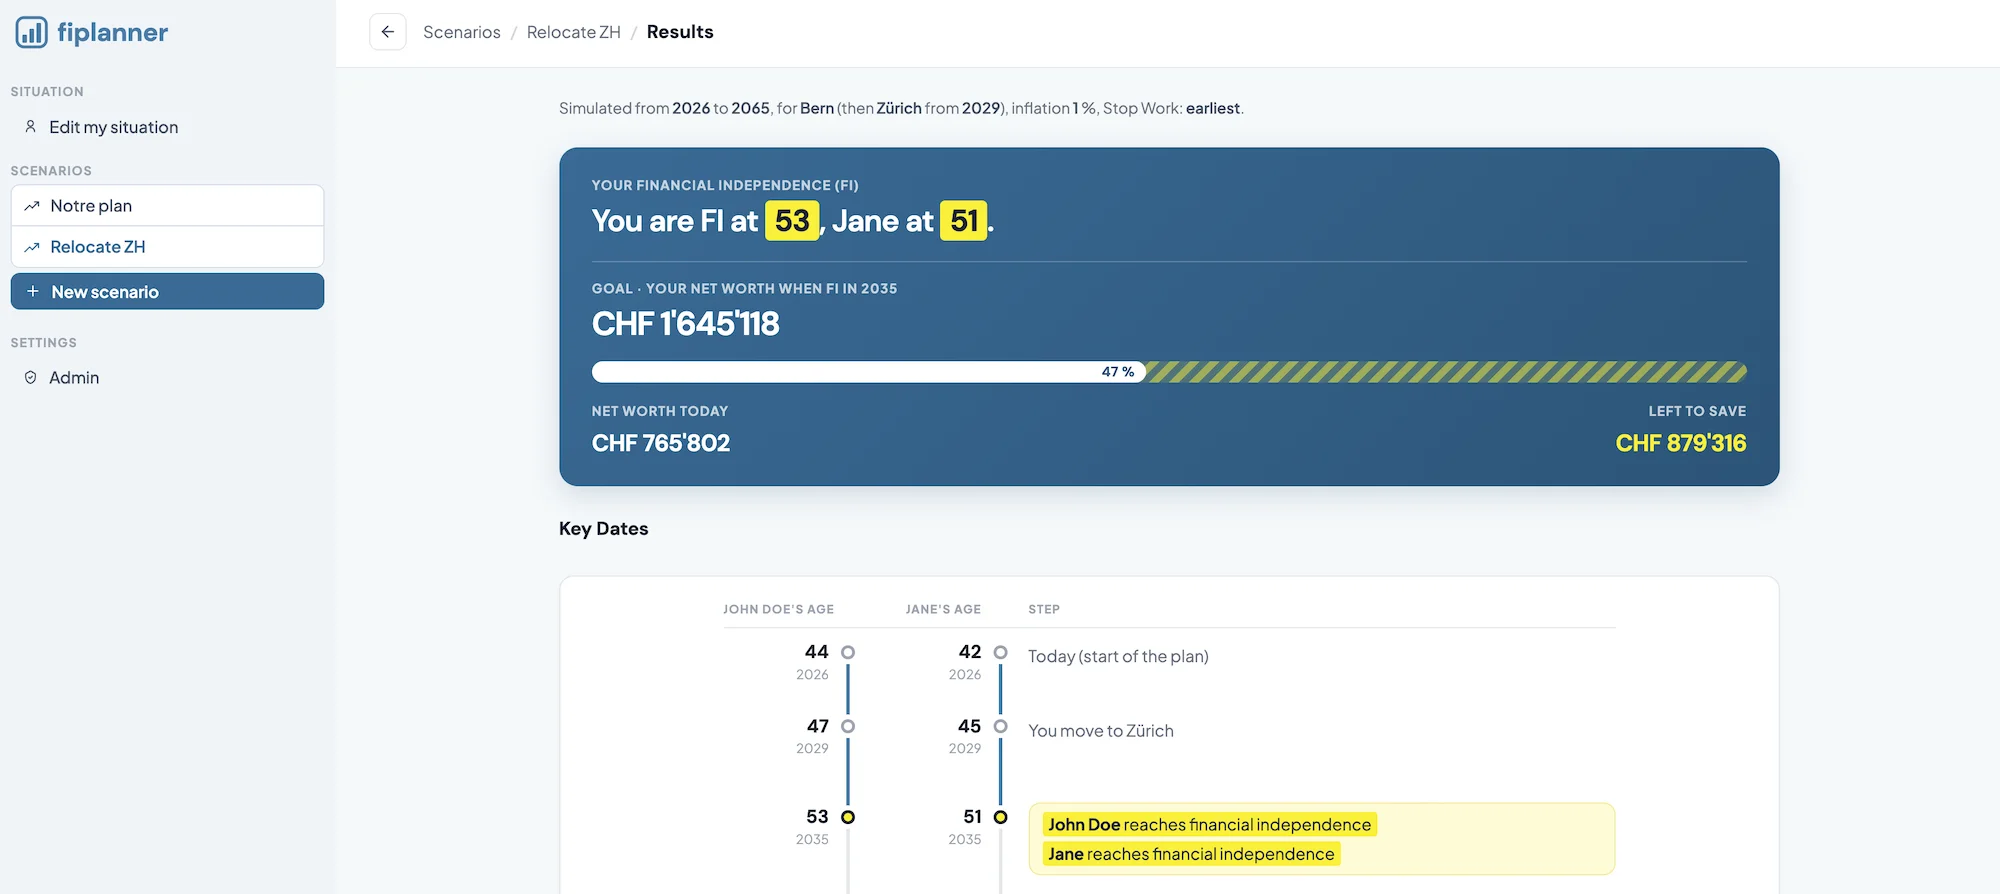
Something was bothering me with the look and feel of the overall central block in all sections.
After comparing it with other tools (such as Claude or Stripe), I realized that most of them had centered the middle content, and better structured both the top header of the sidebar and the middle part.
As I don’t come from a design background, I clearly tried to copy the best ideas of such “trivial” sections in order to understand what works best for an app like ours.
And Patrik and I felt the difference instantly (and I was like, “hmmm, really, just a centered <div> can make all that difference?! haha”):
The edge
We’re rolling out access to waitlist members faster than before, in order to get to public access before the end of the year.
While that feels exciting, it comes with its share of stress. Indeed, even if Patrik automated everything in the back office, you never know if/what can blow up after you click “Send” to dozens of subscribers… but that’s part of the game, and I like the thrill so far!
Note to a friend
Everything takes twice the amount of time you think it will take.
I heard it from an entrepreneur, and it’s true. Every time…
Revamp that homepage? In 4 hours it’s done? Hmmm… it took 1 to 1.5 days in the end.
Reach X customers within 6 months? And a year has already passed…
Why? Well… we humans tend to be overoptimistic about our own capabilities (which is a good thing as an entrepreneur, else you wouldn’t even start a business!). And then there is life. Sickness. Unplanned life events (“hey dad, I have this super-duper complex thing to do at school, and I forgot it’s for the day after tomorrow…”). Or unplanned project-related things, such as handling new customer requests you could never have imagined.
So, just be mindful about it for your own sanity: one project at a time. It takes twice the time you think it will. Complete it. Then move on to the next one (only then!).
Tool of the week
When buying my new MacBook, I got two options: an Apple charger with two USB-C ports, but 35 W. Or the 70 W charger, which is twice as fast (a 50% charge in about 30 minutes).

I was very tempted by the dual charger, as I imagined myself needing to charge my Mac and iPhone simultaneously when traveling. But after reading reviews, many praised the 70 W charger, as it allows you to get a boost in no time. For both the Mac and the iPhone.
I took that option (the fastest charger at 70 W), and never regretted it. It helped me in so many situations while not at home. Even if both devices were running out of battery, I just plugged each one in for 5 to 10 minutes and it was solved. Highly recommended.